April 29, 2026 · Director of Strategic Planning, Shin Chi-hoon
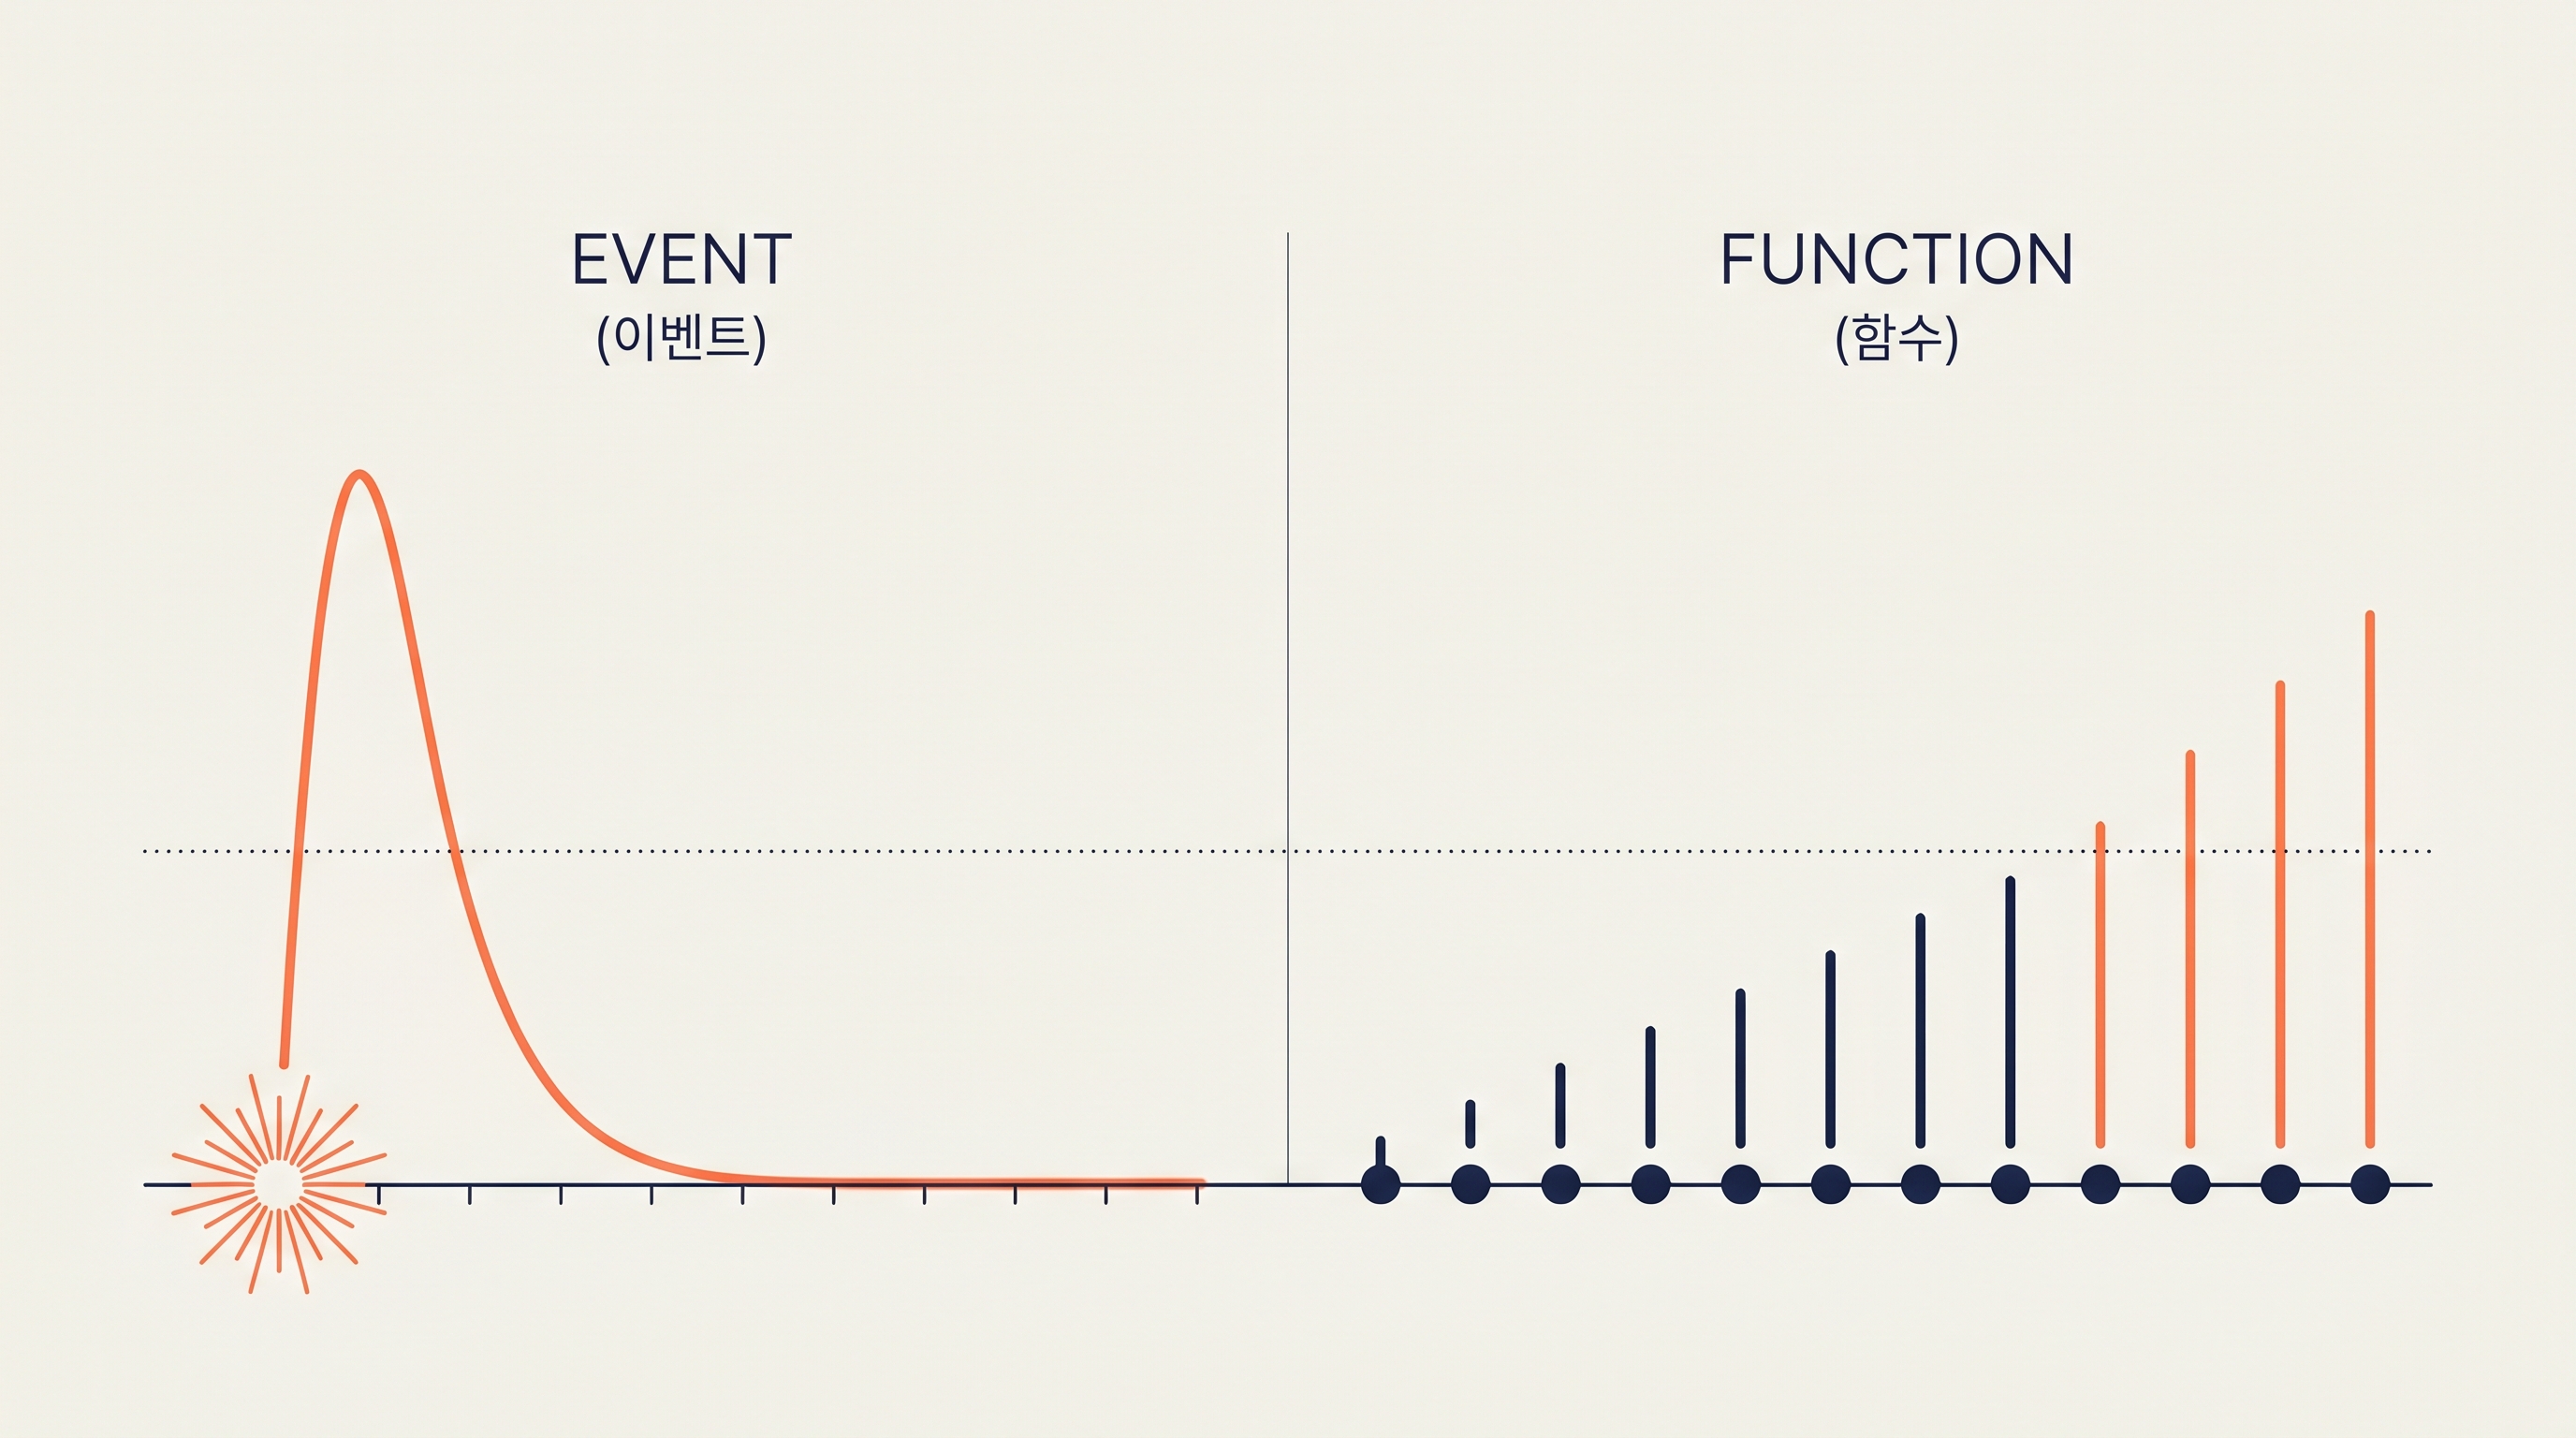
80 out of 80 — why lectures do not stick
Out of 80 people who attended an AI workshop in Yeongyang County, only two opened an AI tool again a month later. Retention: 2.5%.
This number shocks because we assume lectures are events. One exposure should suffice if they were. Results say otherwise. And this result is not unique to Yeongyang. The average completion rate for MOOCs (Massive Open Online Courses) worldwide is 7–10%; the median is 12.6% (Jordan 2014, meta-analysis 2024). One sentence sums it: lectures do not complete anywhere.
The problem is not the lecture itself. It is our assumption that lectures are events. Build on an event model, and even excellent lectures yield single-digit retention. Single-digit retention on policies year after year is the landscape of AI education in Korea.
AX is not an event — it is a function
Behavioral designer BJ Fogg proposed a one-line formula in 2009: B = M × A × P. For someone to perform an action, three things must meet or exceed a threshold simultaneously: Motivation (M), Ability (A), and Prompt (P).
The critical detail is the multiplication sign. Not addition. Multiplication. If any one approaches zero, the result approaches zero. Motivation can be high; if Ability is absent, the action does not happen. Motivation and Ability can both be high; if Prompt is absent at that moment, the action does not happen.
Plug AX (AI transformation) into this formula, and the picture shifts immediately. AX is not a single event but the result of a function where all three accumulate weekly until they cross threshold. A powerful lecture fills Motivation. But if Ability and Prompt are near zero, the product stays near zero. The 78 people in Yeongyang who did not open AI again a month later did not lack Motivation — everyone in that classroom thought "I need to try this." But the following Tuesday morning at 9 a.m., at their desks, the product of low Ability and absent Prompt approached zero.
The instant you see it as a function, all policy looks different. Event model measures lecture cost. Function model measures marginal cost and marginal effect per variable. These are different administrations.
The 66-day curve and rural older adult shame
People often say new behavior becomes a habit in 21 days. This came from one 1960s surgeon's clinical observation, misrepresented as fact — not academic data. Real data exists elsewhere.
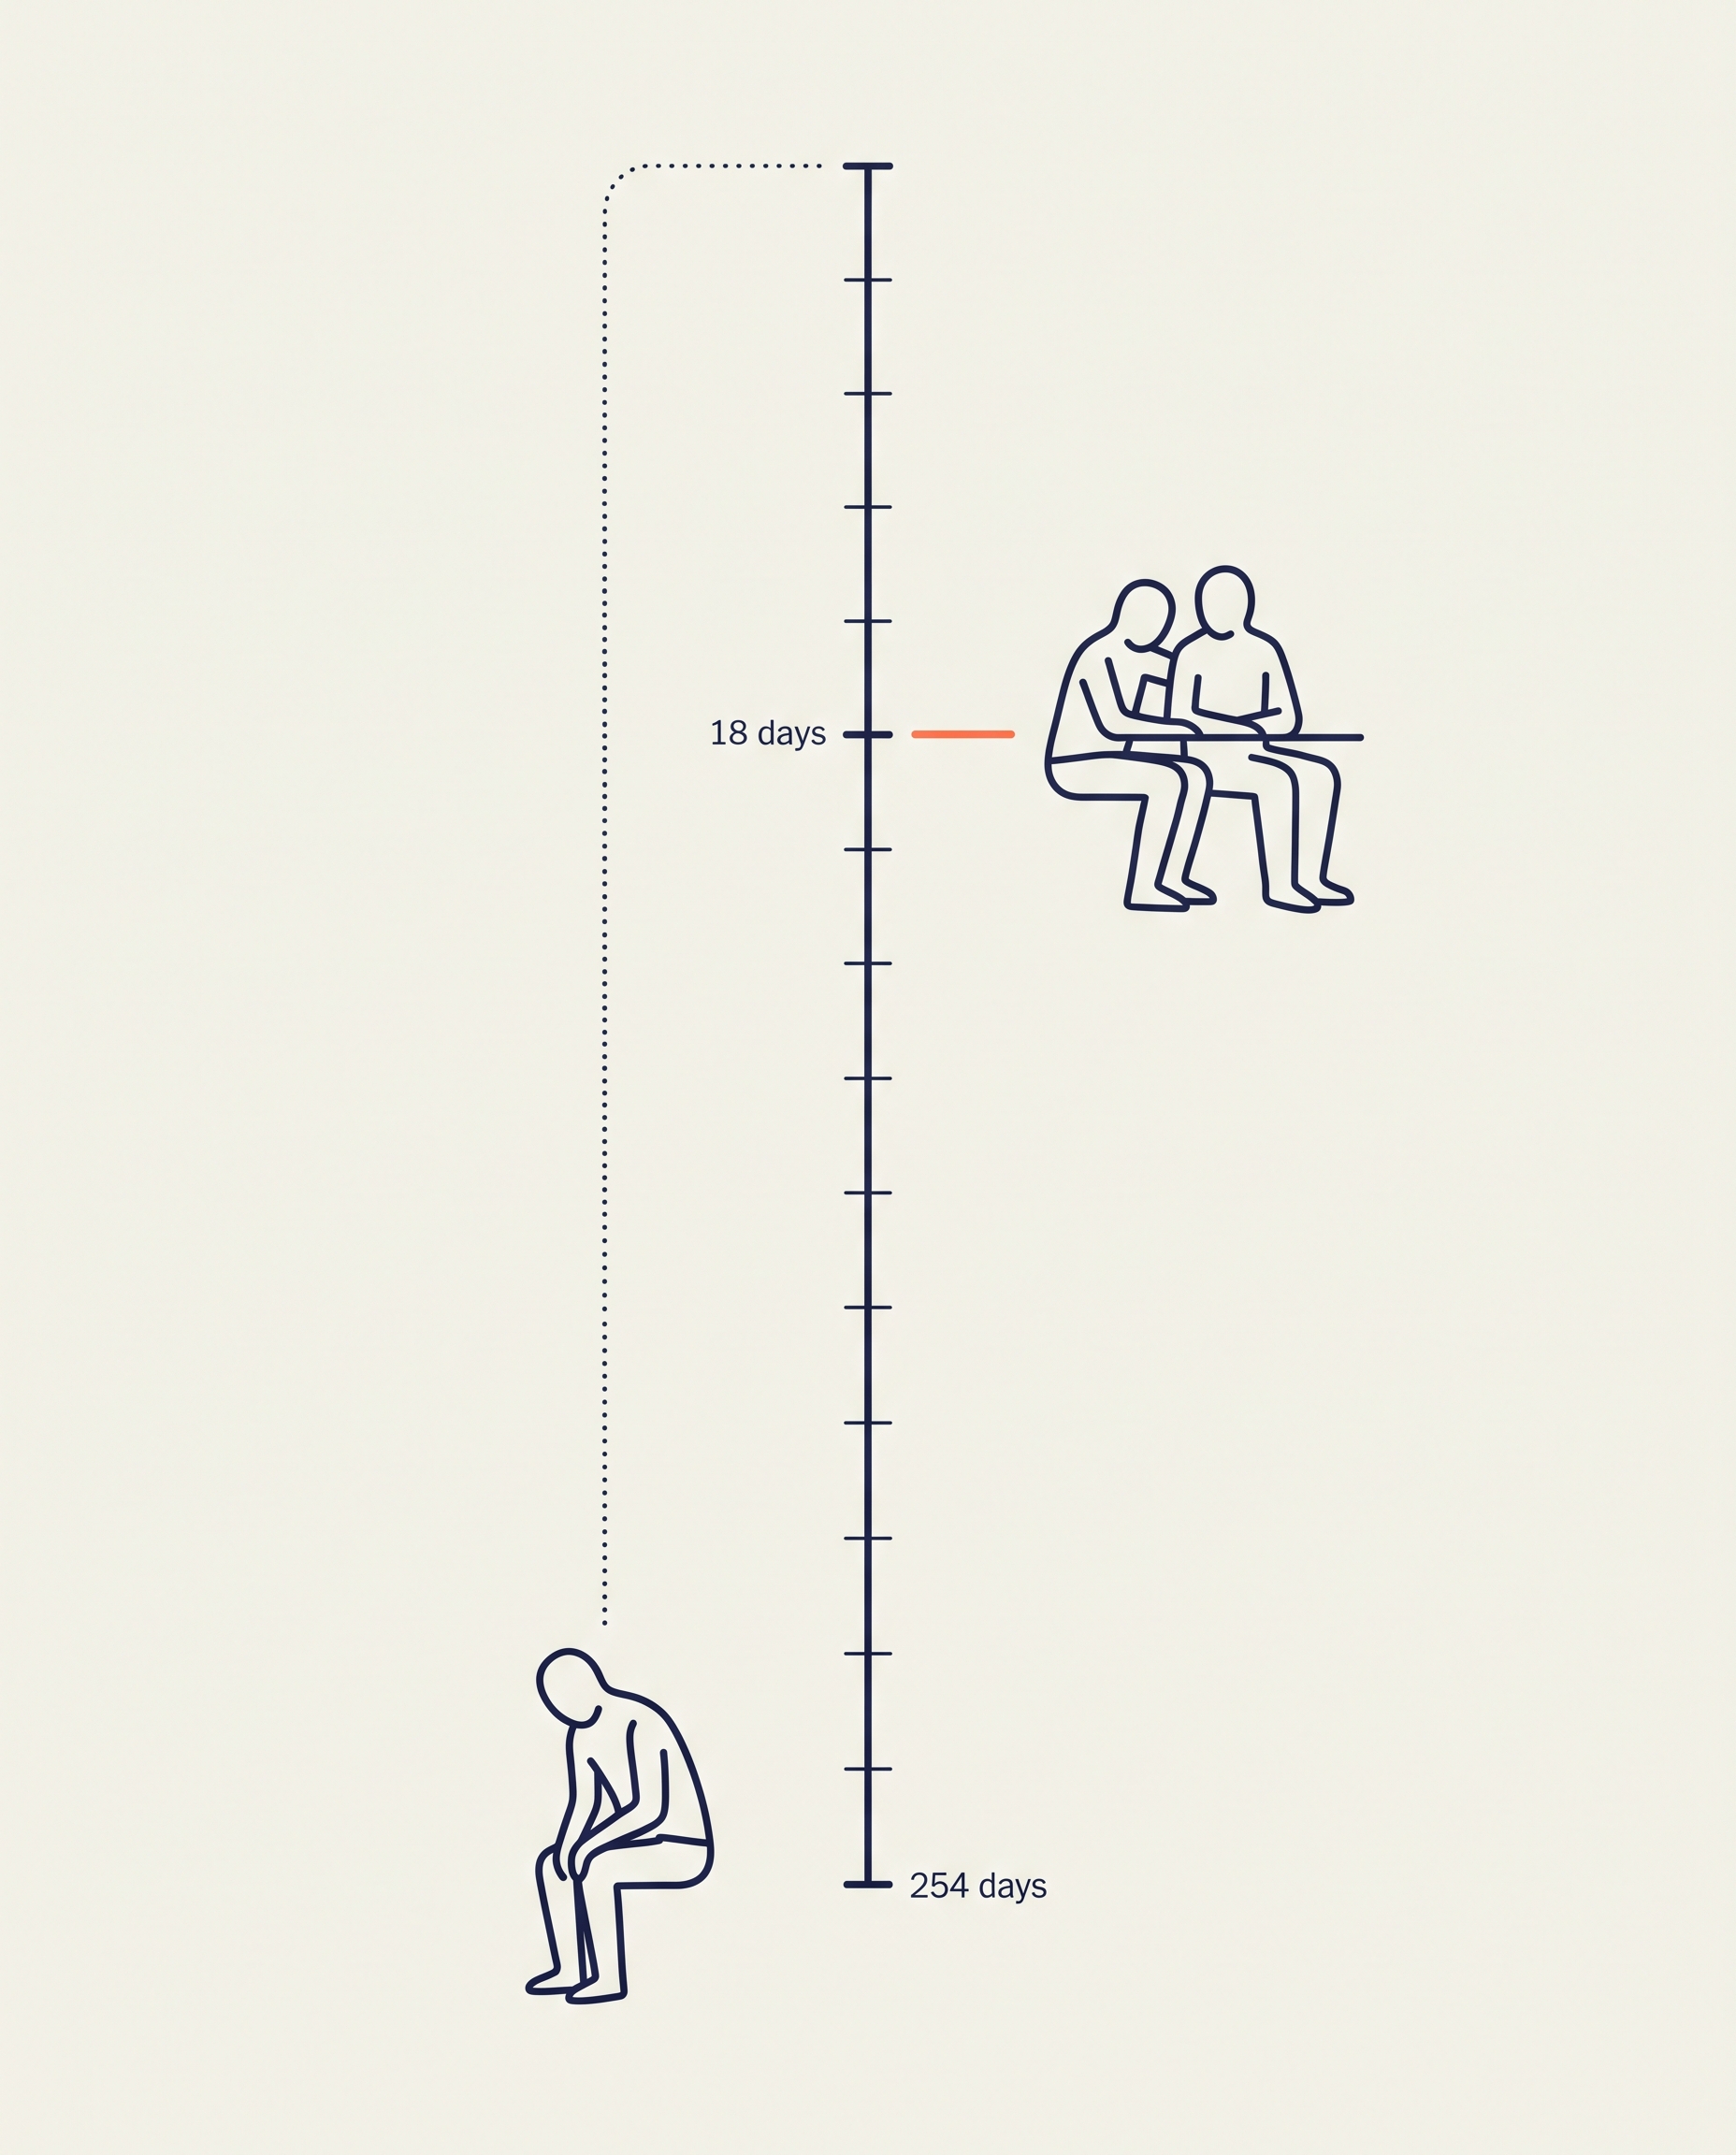
At University College London, Phillippa Lally's team tracked 96 people over 12 weeks (European Journal of Social Psychology, vol. 40, pp. 998-1009). They performed the same new behavior in the same context daily and recorded days until the behavior automated. The average: 66 days. The range: 18 to 254 days. Some crossed threshold in 18 days; others took 254. A 14-fold difference.
Psychologists Wendy Wood and David Neal (2007, Psychological Review, vol. 114 no. 4, pp. 843–863) explained the variance. Habits form as "context-response associations." The more consistent exposure to the same place, time, and cue, the shorter the path to threshold. It was not just willpower. It was environment reliably providing the cue.
Lally's data traces simple motor behavior: drinking water, walking. Using AI tools is more complex. Writing prompts, interpreting results, fitting it into your own work. The curve is longer and steeper. And there is another layer — rural older adults face a barrier before the curve even starts.
Two barriers, documented consistently by OECD's 2024 senior digital learning research and comparative studies: shame and fear of mistakes. Fear that "someone nearby will see that I cannot do this." Fear that "I will press the wrong button and break the machine." These fears drag the Ability variable (A) toward zero. Pump Motivation as high as you want; the product is still zero.
One older adult in Yeongyang entered health records into NotebookLM and asked a question. An answer appeared on screen. "Can it do that?" Eight days to say that. And this person opened NotebookLM again on their own 10 days later. 18 days total. The same speed as Lally's fastest curve. What made those 18 days? Same place, same facilitator, same peers, same voice saying "try once more."
The function's three variables — dividing motivation, ability, prompt
For the function to work, all three must stay alive. But the marginal cost of each differs. Separating cost structure is where policy design becomes possible.
Motivation variable (M) — impact lecture. Lowest marginal cost. One outside expert comes once and lectures to 50 people: a few dollars per person for emotional imprint. Effect is immediate. Motivation peaks when the lecture ends. The problem: Motivation decays fastest. Half gone in a week, near zero in a month.
Ability variable (A) — asynchronous learning. Marginal cost approaches zero. One YouTube video from the association plays to 100 or 10,000 people at no additional cost. One AI tutor chatbot responds at midnight to whoever asks. But asynchronous works only if Prompt is present. You must click the video first. Self-learners cross threshold here. But self-learners are 10–15% of the distribution — the right tail. The other 85% need the next variable.
Prompt variable (P) — same place, same time, same person. Highest marginal cost. The same facilitator must appear at the same time, in the same place, before the same peers, every week. You buy people's time. Yet retention is highest because Wood & Neal's context-response association is strongest here.
When the three variables separate, policy comes alive. M measures emotional scores and post-lecture action intent. A measures daily active users (DAU) and cumulative watch time. P measures six-week consecutive attendance and same-group-to-solo-use conversion one year later. Each variable needs its own KPI. Function-shaped budgeting grows from there.
The trust capillary — most expensive variable
Of the three, the most expensive Prompt variable has trust as its essence. Appearing in the same place every week is an infrastructure of trust: "it is safe to fail here." For rural older adults, this trust accumulates slowly.
Markets do not create this trust. Markets spend on ads and user signups; they do not send people to the same place weekly. Government's average policy does not either — the average assumes urban 30-year-olds. For a 70-year-old in Yeongyang, the trust capillary must be built at the county level, by human hands.
Wood & Neal's academic phrase "same person" carries extra weight in rural areas. An older adult in Yeongyang knows: "who taught me AI matters." Not classroom authority, but someone they have seen at municipal office, at the agricultural cooperative, a neighbor. That person appearing in the same place again lifts Ability away from zero.
This is the capillary. Without a fine capillary between the great artery (central government budget) and the main vein (national digital policy), oxygen does not reach the cells. The function's most expensive variable is created only in the narrowest place, by the nearest person.
Function-shaped budgeting — Yeongyang 100-person model
Even if the function is sound, policy must follow. Separating marginal cost to achieve threshold with 100 people in one year budgets like this:
| Variable | Item | Annual | Per person |
|---|---|---|---|
| Motivation (M) | 3 external impact lectures | ₩3M | ₩30K |
| Ability (A) | Async content + AI tutor operations | ₩2M | ₩20K |
| Prompt (P) | 5 local facilitators trained & operated | ₩10M | ₩100K |
| Total | ₩15M | ₩150K |
67% of cost goes to the Prompt variable. This is the function model's core message: Human time is most expensive and most decisive.
Evaluation is function-shaped too. M's KPI: post-lecture action intent vs. week-four self-use rate difference. A's KPI: async content DAU and cumulative study time. P's KPI: six-week consecutive meeting attendance and same-group one-year solo-use conversion. All three accumulate to solve the function.
Existing AI education subsidies concentrate on M alone — lecture fees, instructor pay, materials. That is why retention is 5–10%. Function budgeting does not concentrate on one variable. It thinks three together, measures three together.

Conclusion — ending the time of events
Under the event model, Korea's AI education policy contracts for lectures every year, records 5–10% retention every year, writes the same report every year. This cycle does not end because the assumption of "event" does not end.
The function model buys different time. One group crosses threshold in 1.5 to 3 years, and that group becomes the Prompt variable for the next. When one older adult in Yeongyang crosses threshold in 18 days, that person becomes the "same person" in the same place for the next group. The function replicates itself.
If this reaches policy makers: split the "AI education" line item. Not one line, but three function-shaped lines: M · A · P. To education institutions: measure self-use rate 30 days after lecture as a KPI. To AI instructors themselves: begin by admitting your lecture is one variable only.
Yeongyang County AI Association intends to be this function's Prompt variable. Not because we alone can, but because no one else sends the same person to the same place every week. The time of events is long spent. It is time to begin the time of functions.
Sources:
- Lally, P., van Jaarsveld, C. H. M., Potts, H. W. W., & Wardle, J. (2010). How are habits formed: Modelling habit formation in the real world. European Journal of Social Psychology, 40(6), 998-1009. doi:10.1002/ejsp.674
- Wood, W., & Neal, D. T. (2007). A new look at habits and the habit-goal interface. Psychological Review, 114(4), 843-863.
- Fogg, B. J. (2009). A Behavior Model for Persuasive Design. Persuasive '09: Proceedings of the 4th International Conference on Persuasive Technology.
- Jordan, K. (2014). MOOC Completion Rates: The Data — subsequent meta-analyses (2023–2024) reconfirm 7–10% average, 12.6% median.
- OECD (2024). Digital Skills for Seniors — identifies shame and fear of mistakes as key barriers to elderly digital learning.
- Frontiers in Psychology (2025). Influencing factors of digital health technology anxiety in the elderly — meta-analysis confirms social support as critical mediator for tech adoption.
- Yeongyang County AI Association internal workshop data (March 2026). 80 attendees → 2 solo users at week 4 (2.5%)
The illustrations in this article were created using AI image generation (Gemini 3 Pro Image) and underwent editorial review by Yeongyang County AI Association.

This article was produced with the deep-thinking engine
Simthink Engine (深 Think) of Myeongseong Simjae.